All teams must text scores to Paul 236-458-1358 the night of the game. Failure to do so will result in a 0-0 tie. Please report forfeits, rainouts, and postponed games.

It helps if you include the game ID#.

2022 League Statistics

Div Place Team Win % Points Wins Losses Ties GP RF RA RF/GP RA/GP
11Slammers0.9044722132639715315.275.88
12Brew Jays0.8654522312631011411.924.38
13Sons of Pitches0.8404220322536017914.407.16
14Pounders0.6733517812629223611.239.08
15No Chucks Given0.6523015802324722710.749.87
16Odd Ballz0.55829141112627023010.388.85
17Mission Accomplished0.4802412130252303219.2012.84
18Tailgaters0.42322111502626529610.1911.38
19Rattlers0.413199131231922608.3511.30
110Misfits0.396199141242352969.7912.33
111The Duckers0.3271781712627426410.5410.15
112Ballistics0.220115191251903107.6012.40
113The Hosers0.15484220262103568.0813.69
114Dewdney Ballers0.0874221023873173.7813.78
League Standings are calculated by Win Percentage, then Runs For Per Games Played, then Runs Against Per Games Played.
Win percentage is calculated by Total Points divided by Total Potential Points.
Total Potential Points is calculated by Games Played times 2 points per game.
Last updated: Monday, July 11th, 2022, 9:52 pm

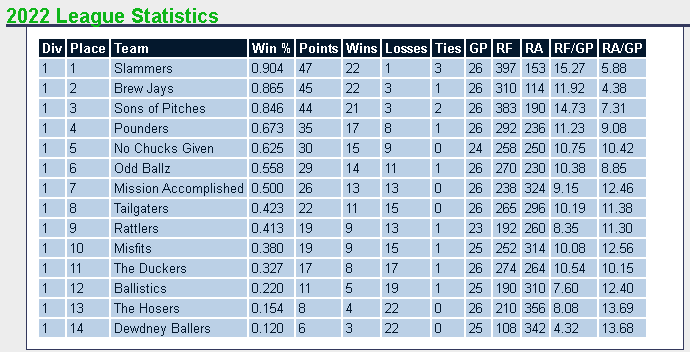
Past League Statistics